
Search for, analyse, and track deep-value stocks, effortlessly
Our software is custom designed for deep-value investors.
It includes key metrics that are difficult to find using traditional screeners and tools.
The software is composed of a screener, stock valuation tool and watchlist tracker.
We built this to assist our own stock research process and use it daily.
Read below to learn exactly what is included and how it can help you uncover more deep-value opportunities.
Access our deep-value software
We're in beta mode right now, but we'll let you know when its ready for general use.
How it started
Searching for cheap stocks can be laborious.
After constructing my initial portfolio, using free screeners, a big-buttoned calculator, and a pen and paper, I decided to build a spreadsheet.
The goal was to allow me to type in a ticker and instantly display the key valuation metrics that any conservative deep-value investor would want to see.
I’m talking NCAV Ratio, TBV Ratio, EV/E Ratio, P/E Ratio and Shareholder Yield etc.
I wanted to turn more rocks over, quicker.
The sheet worked well, but I was hungry for more.
More context and visibility into each businesses financials and more speed and efficiency to help me find more ideas.
So, I decided to build my own software....
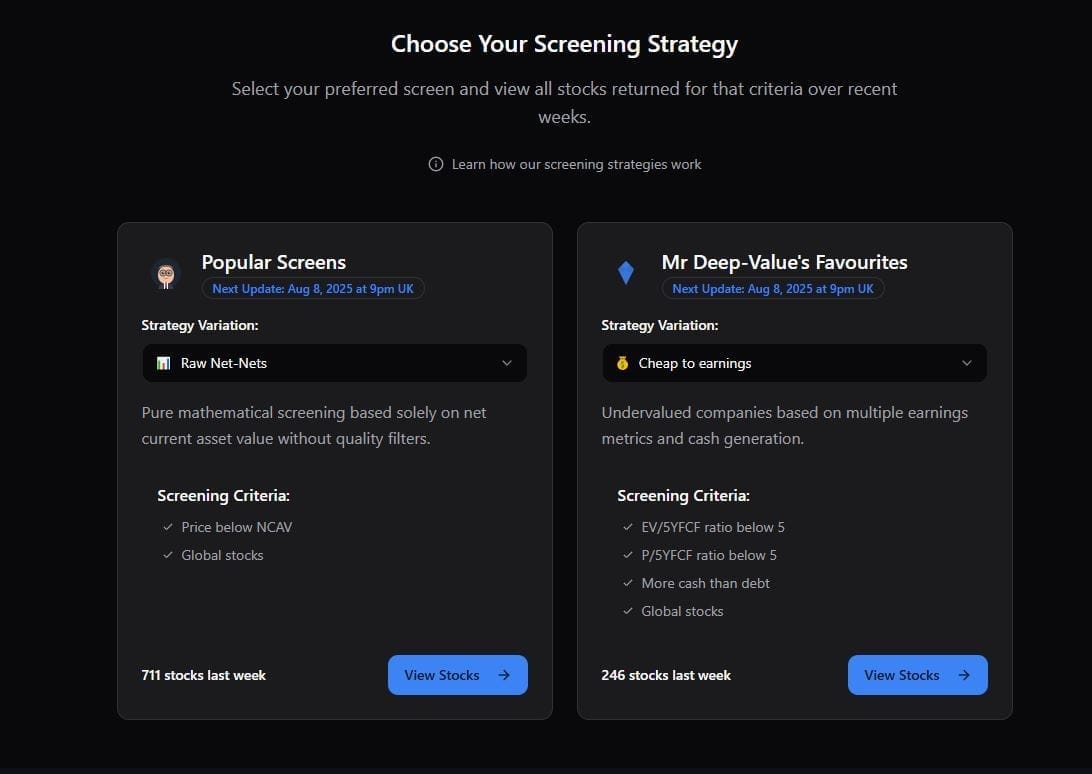
Deep-Value Metrics
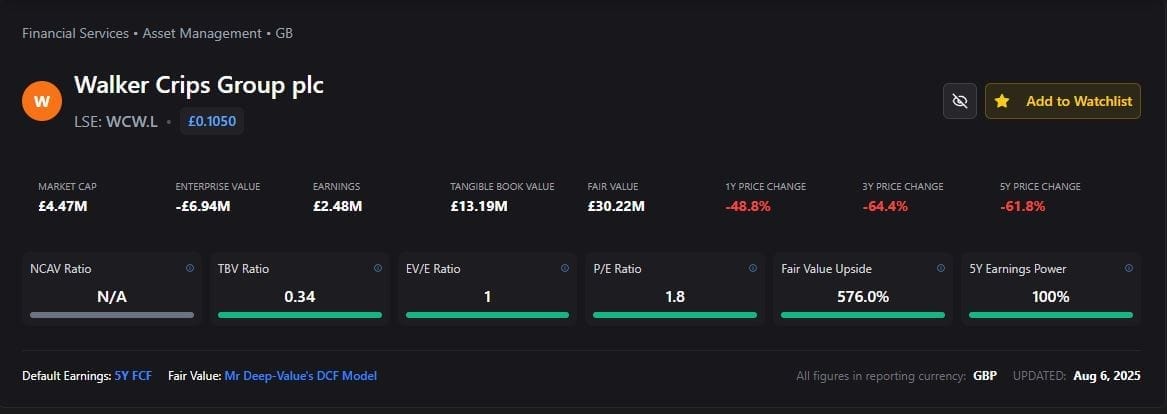
Type a stock ticker to generate an instant deep-value analysis.
Our view includes NCAV Ratio, TBV Ratio, EV/E Ratio, P/E Ratio, earnings consistency and average shareholder yield.
See at a glance, whether the stock is cheap to assets, earnings or both.
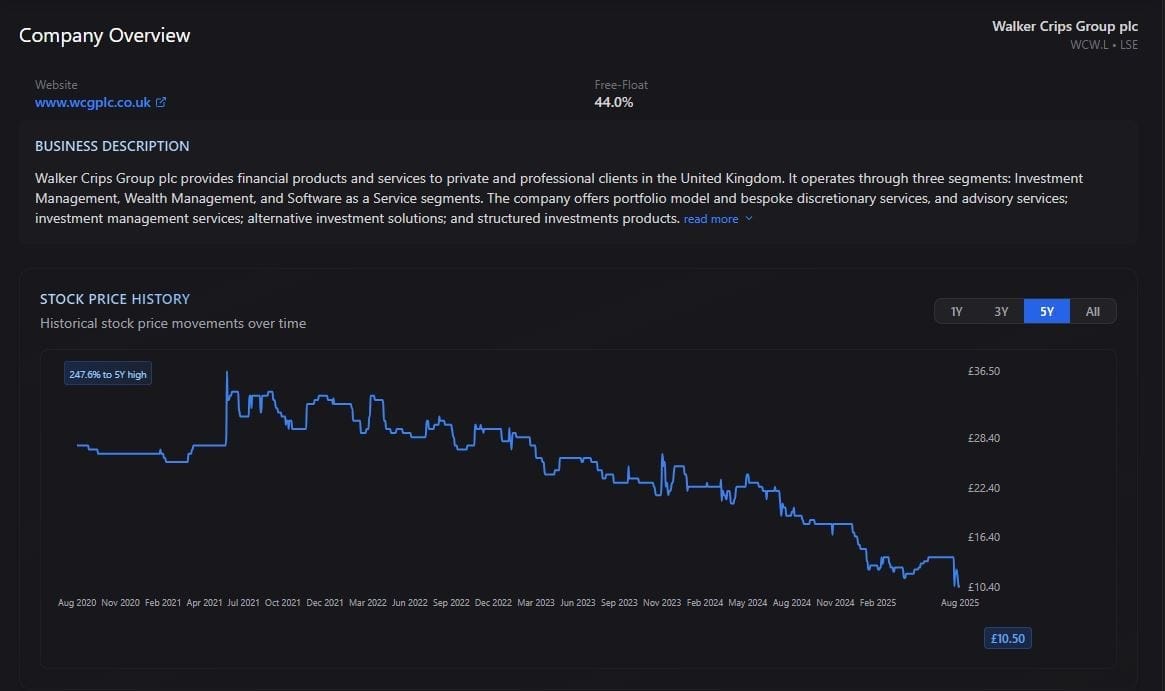
Company Overview
Quickly see if the stock price has fallen significantly or if it's a perennially cheap stock.
This can be the difference between eking out marginal gains over time or doubling or even tripling your money within 2-3 years.
It displays the company website along with the free float percentage.
If there are enough shares for an activist to take a meaningful stake (or even control) this can be a positive sign.
Price vs Value History
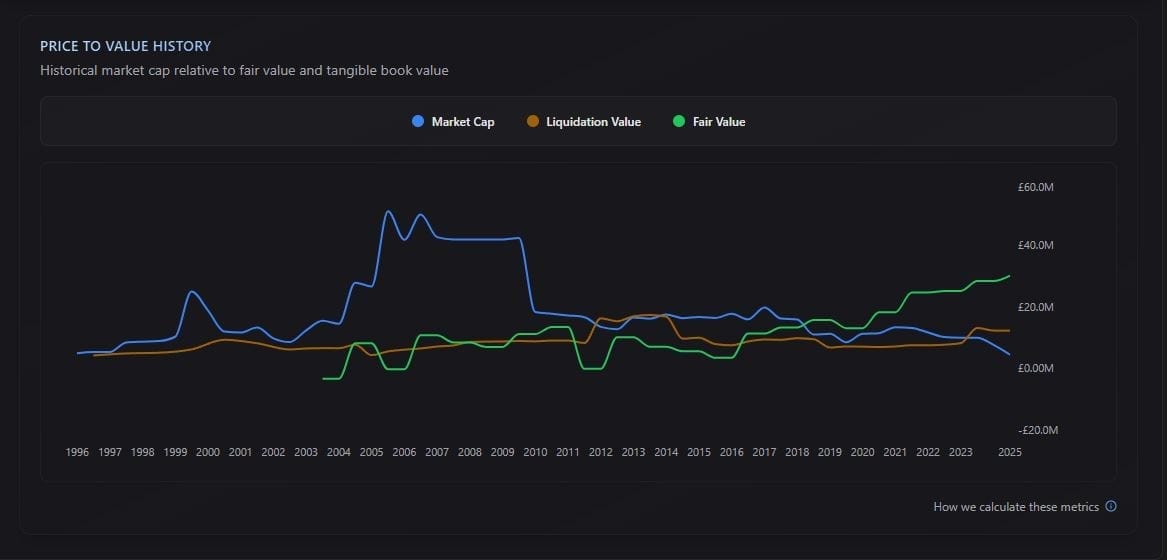
We track the historical liquidation value of the business, and our own 'fair value' calculation and compare it to the market cap.
This allows you to see how the price has moved relative to these valuations over time, and also how it relates today.
Stocks trading below fair value or liquidation value are often fantastic deep-value opportunities.
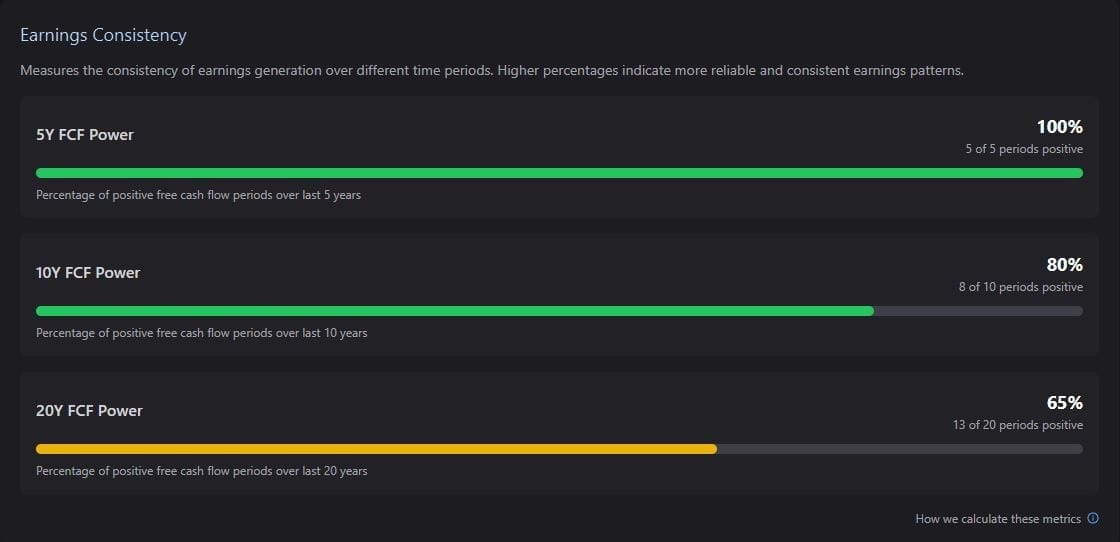
Earnings Consistency
The best opportunities are when a business is priced as if it will never make money again.
The only task for an investor is to ascertain if this is likely or not.
Businesses with consistent, positive earnings over decades are much more likely to recover back to their mean-average.
This display identifies these types of opportunity quickly.
Historical Earnings Comparison
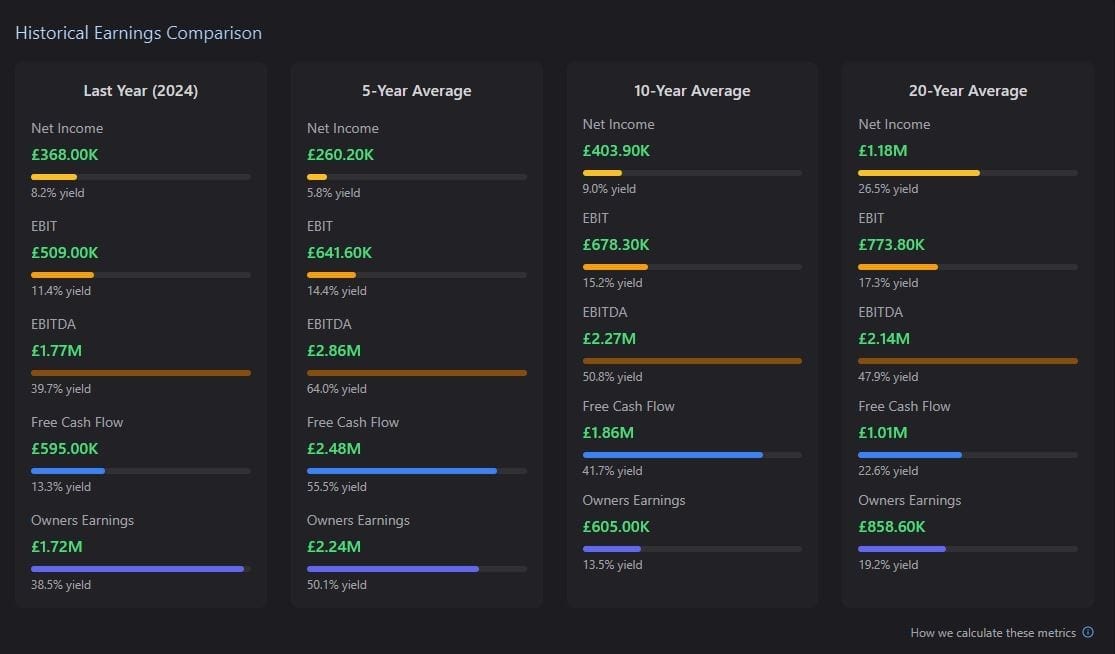
Instantly view the historical averages for all major earnings types.
This lets you see how cash-based earnings align with accounting based earnings over time.
This helps you avoid (or at least, be aware of) companies that are inflating one type of earnings in order to attract a higher stock price.
It can also highlight source-data errors, such as when customer deposits artificially inflate free-cash-flow.
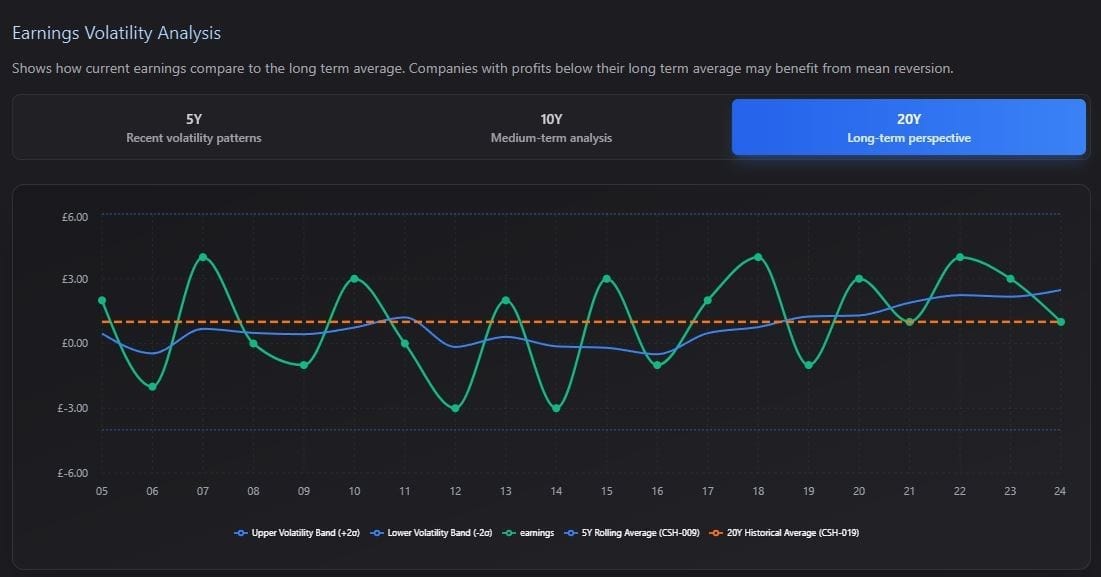
Earnings Volatility Analysis
This shows us where current earnings are, in relation to the 20-year average and the rolling 5-year average.
When earnings drop below these averages, it could be a sign that earnings will soon revert back.
We can also view the difference to 2 standard deviations. The closer earnings get to these extremes, the more likely reversion is to occur in a mediocre business.
When a deep-value stock has deviating earnings, one only needs to assess the likelihood of terminal decline.
Tangible Asset Analysis
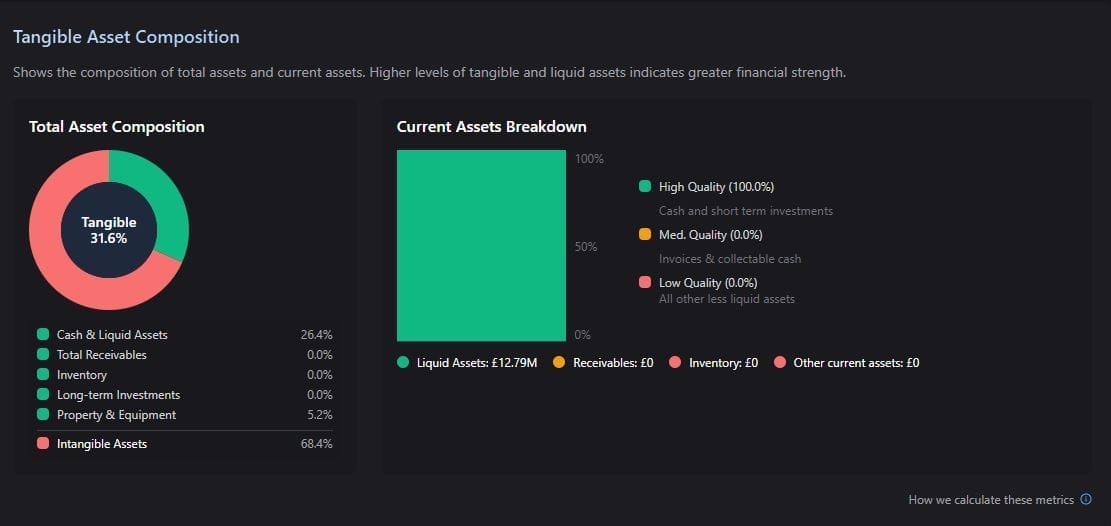
A core tenet of deep-value investing is the down-side protection provided by business assets.
If you can buy at or below this value, you stand a very good chance of not losing money, even in a worst case scenario.
Our asset composition display shows you how much of the assets are tangible and also what percentage of current assets are liquid.
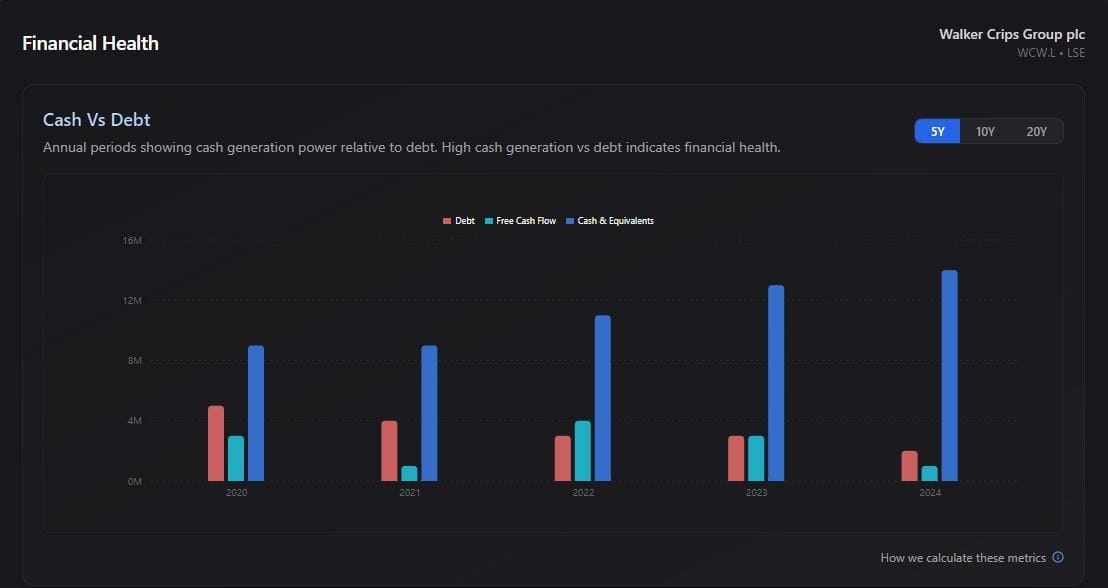
Financial Health
This view, compares total cash & liquid assets with total debt and free cash flow for each period.
Our goal is to find businesses that are financially sound with almost zero chance of becoming insolvent any time soon.
Businesses with lots of cash, no debt and consistently positive free-cash-flow are often considered healthy and protected against terminal decline, to a greater degree than businesses with lower cash and higher debt burdens.
Shareholder Yield Analysis
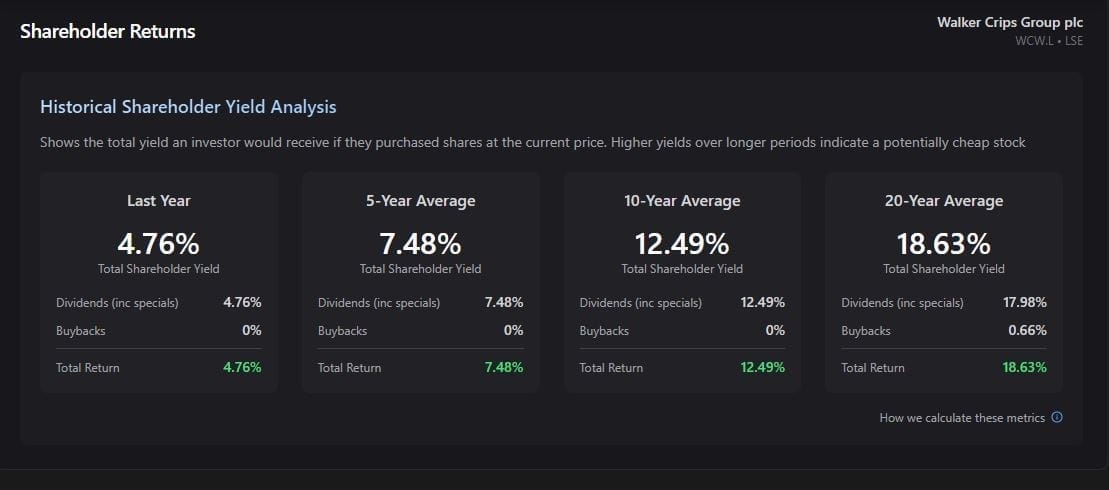
This shows what our yield would be if we received historical dividends (we also count buybacks) at todays market cap.
Higher dividends and buybacks adds an extra safety net in case an external catalyst fails to materialise.
These often cause prices to rerate higher, when they’re delivered.
Access our deep-value software
We're in beta mode right now, but we'll let you know when its ready for general use.